Understanding the performance of your investments is crucial for making informed financial decisions. One key metric that helps investors evaluate their investment performance is the CAGR, or Compound Annual Growth Rate. It represents the average rate of growth of an investment over a specified period, assuming that any profits are reinvested at the end of each year.
Our Compound Annual Growth Rate Calculator simplifies the process of calculating the CAGR, providing a clear picture of your investment’s growth trajectory. By using this calculator, investors can easily compare different investment opportunities and assess their performance over time.
Key Takeaways
- Use our Compound Annual Growth Rate Calculator to measure the average yearly growth of your investments.
- Understand how CAGR differs from simple growth metrics by accounting for the compounding effect.
- Evaluate different investment opportunities by comparing their CAGR values.
- Assess the steady rate at which your investment has grown over a specific period.
- Make informed financial decisions by understanding the CAGR formula and its applications.
Understanding Compound Annual Growth Rate (CAGR)
CAGR stands out as a key performance indicator that helps investors understand the average annual growth rate of their investments. It provides a clearer picture of an investment’s performance over time by smoothing out fluctuations.
Definition and Importance of CAGR
The Compound Annual Growth Rate is a measure of an investment’s annual growth rate over a specified period, assuming that any profits are reinvested. It’s crucial for evaluating the past performance of an investment and making informed decisions about future investments. By using CAGR, investors can compare the growth rates of different investments on a level playing field.
How CAGR Differs from Simple Growth Rate
A key distinction between CAGR and the simple growth rate lies in how they account for the compounding effect over time. Unlike the simple growth rate, which merely calculates the total percentage change, CAGR provides an annualized rate that reflects the effect of compounding. This difference becomes more pronounced over longer investment periods, making CAGR a more accurate metric for assessing year-over-year performance.
Understanding this difference is vital for investors, as it enables them to make rate comparisons between various investment opportunities. By standardizing growth to an annual basis, CAGR facilitates a more nuanced evaluation of investment performance.
The CAGR Formula Explained
The CAGR formula is derived from the compound interest formula and is used to assess investment performance. It provides a smoothed-out average annual rate of return over a specified period, helping investors understand the growth trajectory of their investments.
Components of the CAGR Formula
The CAGR formula involves several key components: the future value (FV) of the investment, the present value (PV) or initial investment, and the number of years (t) the investment is held for. Understanding these components is crucial for accurately calculating CAGR.
- The future value represents the final amount of the investment after the specified period.
- The present value is the initial amount invested.
- The number of years is the duration for which the investment is held.
Mathematical Breakdown of the Formula
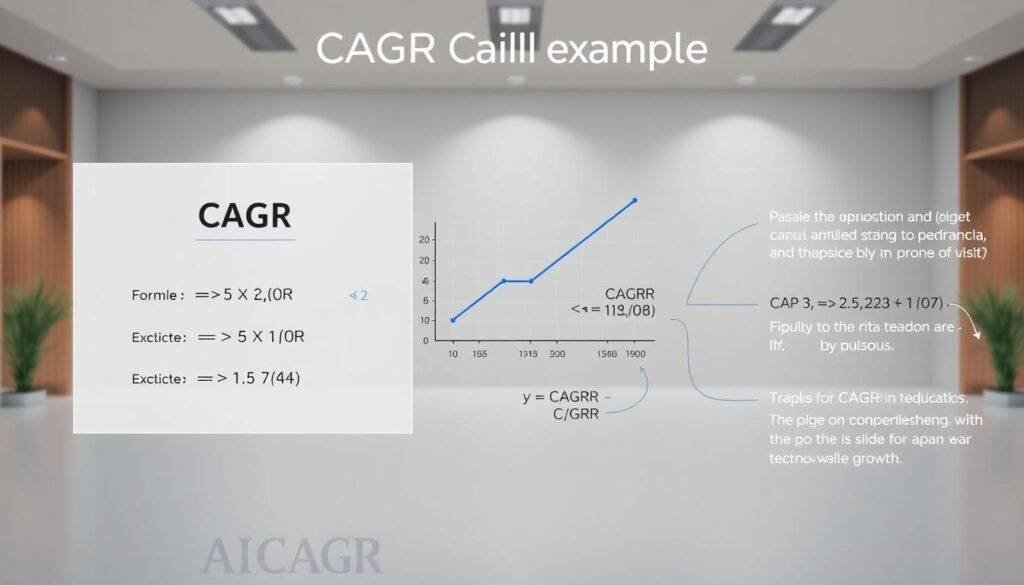
The CAGR formula is mathematically expressed as: CAGR = (FV / PV)^(1/t) – 1. This formula calculates the average annual growth rate by raising the ratio of the future value to the present value to the power of one divided by the number of years, then subtracting one to obtain the rate.
- The exponent (1/t) converts total growth over the period into an equivalent annual rate.
- The subtraction of 1 converts the ratio into a percentage growth rate.
- This formula effectively “smooths out” the growth, presenting it as a constant annual rate.
How to Calculate CAGR Manually
Calculating CAGR manually is a straightforward process that requires a few key pieces of information, including the beginning and ending values of the investment and the number of years.
To calculate CAGR, we need to understand the formula and apply it correctly. The formula takes into account the investment period and the growth rates over that time.
Step-by-Step Calculation Process
To manually calculate CAGR, follow these steps:
- Determine the beginning and ending values of the investment.
- Calculate the number of years in the investment period.
- Apply the CAGR formula: (End Value / Beginning Value)^(1/Number of Years) – 1.
Common Calculation Mistakes to Avoid
When calculating CAGR, several common mistakes can lead to inaccurate results. These include:
- Incorrectly counting the time period, especially when using year-end values.
- Using inconsistent time units, such as mixing months and years.
- Mistakingly using simple averages of annual growth rates instead of the CAGR formula.
- Failing to account for negative starting or interim values.
- Selection bias by choosing inappropriate start and end points, which can impact the resulting CAGR and misrepresent the true value.
By avoiding these mistakes and correctly applying the CAGR formula, we can accurately determine the CAGR of an investment over a specified period.
Using Our Compound Annual Growth Rate Calculator

Our Compound Annual Growth Rate (CAGR) calculator is designed to simplify the process of calculating investment growth or decline over a specified period. With this tool, you can easily determine either the final value of your investment or the growth rate, making it an invaluable resource for investors.
Features of Our CAGR Calculator
Our CAGR calculator offers several key features that make it user-friendly and versatile. It allows you to calculate the future value of your investment by inputting the growth rate (CAGR), number of periods, and initial value. Conversely, you can determine the CAGR by entering the number of periods, initial value, and final value. Advanced options are also available, such as adjusting for inflation or accounting for regular contributions.
How to Input Your Data Correctly
To use our CAGR calculator effectively, follow these guidelines:
– Select the calculation mode based on the variable you need to determine (CAGR, final value, initial value, or time period).
– Input the initial investment value (present value) without subsequent additions or withdrawals.
– Enter the final investment value (future value) including all accumulated growth.
– Use decimal points for partial years when entering the time period.
By following these steps and utilizing our CAGR calculator, you can make informed decisions about your investments and assess their performance accurately.
Practical CAGR Calculation Examples
To illustrate the practical application of Compound Annual Growth Rate (CAGR), let’s examine a few examples. These examples will help clarify how CAGR can be used to evaluate the growth of investments and businesses over time.
Investment Growth Example
Consider a company, Big Bite, whose market value between 2012 and 2018 is given. To calculate the CAGR, we use the formula: CAGR = (Ending Value / Beginning Value)^(1 / Number of Years) – 1. For Big Bite, this translates to CAGR = ($450,000 / $310,000)^(1/7) − 1 = 5.4682%. This means the average yearly increase for Big Bite during 2012-2018 was 5.4682%.

Business Revenue Growth Example
Let’s examine a business case where a company’s annual revenue grew from $2.5 million in 2018 to $4.1 million in 2023. To find the CAGR, we first divide the final revenue by the initial revenue, resulting in a growth multiple of 1.64. We then raise this value to the power of 1/5 (representing the five-year period), which equals 1.64^0.2. The result is approximately 1.1043, and after subtracting 1, we get a CAGR of 0.1043 or 10.43%. This indicates that the company’s revenue grew at an average annual rate of 10.43% over the five-year period.
Using CAGR, businesses and investors can effectively evaluate growth performance and make informed decisions.
Applications of CAGR in Financial Analysis
CAGR is a vital tool in financial analysis, enabling the comparison of growth rates across different investments, business segments, and timeframes. It provides a comprehensive view of how an investment or a business has performed over a specific period.
Evaluating Investment Performance with CAGR
We use CAGR to evaluate the performance of investments by calculating the rate of return over a specified period. This helps investors understand the compound annual growth rate of their investments, making it easier to compare different investment opportunities. Businesses also utilize CAGR to assess growth across various metrics, including revenue, profit margins, and customer base.
CAGR for Assessing Business Growth
For businesses, CAGR is a valuable metric for assessing growth and setting realistic targets. Corporate strategists rely on CAGR to evaluate the effectiveness of long-term business initiatives. It also helps in identifying sectors that are experiencing sustainable growth versus those with stagnant or declining market performance. Furthermore, CAGR provides a standardized method to evaluate target companies’ historical growth patterns during mergers and acquisitions.
Advantages and Limitations of Using CAGR
To make informed investment decisions, it’s essential to grasp both the benefits and limitations of CAGR. CAGR is a valuable tool for evaluating investment performance over time, providing a smoothed rate of return. However, like any financial metric, it has its strengths and weaknesses.
Benefits as a Measurement Tool
The primary benefit of CAGR is its ability to simplify complex growth patterns into a single, easy-to-understand rate. This makes it easier for investors to compare different investment opportunities. CAGR is particularly useful for long-term investments, as it helps to average out the returns over the investment period, giving a clearer picture of the investment’s overall performance.
For instance, when comparing two investments with different growth patterns, CAGR can provide a straightforward comparison. It also helps in understanding the compounding effect on investments over time.
| Investment | Initial Value | Final Value | CAGR |
|---|---|---|---|
| Investment A | $1,000 | $1,500 | 8% |
| Investment B | $1,000 | $2,000 | 10% |
Limitations and Potential Misinterpretations
Despite its benefits, CAGR has several limitations. One of the main drawbacks is that it masks volatility by presenting growth as smooth and constant, potentially hiding significant interim fluctuations that could indicate investment risk. Additionally, CAGR does not account for the timing of gains and losses within the measurement period, which can be crucial for investors with specific liquidity needs.
Other limitations include its inability to calculate the profitability of investments with inflows and outflows during the period and the potential for manipulation by carefully selecting start and end dates. 
- CAGR does not take into account investment risk.
- It reflects a smoothed growth rate, not the actual volatility.
- CAGR is not suitable for investments with cash inflows or outflows.
CAGR vs. Other Growth Metrics
CAGR is one of several metrics used to assess growth, but how does it compare to other measures like Average Annual Growth Rate (AAGR) and Year-Over-Year (YOY) growth? Understanding these differences is crucial for accurate financial analysis.
CAGR vs. Average Annual Growth Rate (AAGR)
AAGR calculates the average rate of return for a period, but it doesn’t account for compounding. In contrast, CAGR factors in the effect of compounding over multiple years, providing a more accurate picture of growth over time.
CAGR vs. Year-Over-Year Growth
Year-Over-Year (YOY) growth measures the percentage change between corresponding periods, typically annual. While YOY captures short-term fluctuations, CAGR smooths out these variations to give a single growth rate over the entire period.
| Metric | Description | Use Case |
|---|---|---|
| CAGR | Smoothed growth rate over multiple years, accounting for compounding. | Long-term investment performance, strategic planning. |
| AAGR | Average rate of return without considering compounding. | Simple average return calculation. |
| YOY Growth | Percentage change between corresponding periods. | Short-term trend analysis, operational decisions. |
Conclusion
As we conclude our exploration of the Compound Annual Growth Rate (CAGR) and its significance in investment analysis, it’s clear that this metric plays a crucial role in financial decision-making. The CAGR calculator provides an essential tool for investors seeking to understand the true performance of their investments over time.
By accounting for the compounding effect, CAGR offers a more accurate representation of investment growth than simple averages or year-over-year comparisons. While CAGR has limitations, it remains a widely used and respected metric in financial analysis. We encourage you to use our Compound Annual Growth Rate Calculator regularly to track your investments’ performance and ensure they’re on track to meet your financial goals.
Remember, CAGR should be used as one of several metrics in a comprehensive analysis, complemented by risk assessments and consideration of your specific financial objectives.
FAQ
What is the difference between CAGR and simple growth rate?
CAGR takes into account the effect of compounding, providing a more accurate picture of investment returns over time, whereas simple growth rate does not consider compounding.
How do I calculate CAGR for an investment with multiple cash flows?
To calculate CAGR for an investment with multiple cash flows, we need to know the initial and final values of the investment, as well as the time period. Our CAGR calculator can simplify this process.
What are the limitations of using CAGR as a measurement tool?
CAGR has limitations, including not accounting for volatility and risk associated with an investment. It is also sensitive to the time period chosen.
Can CAGR be used to evaluate business performance?
Yes, CAGR can be used to assess business growth by analyzing revenue or profit over time, providing insights into a company’s performance.
How does CAGR differ from average annual growth rate (AAGR)?
CAGR is a geometric mean return, while AAGR is an arithmetic mean return. CAGR is more suitable for evaluating investment performance over time.
What is the ideal time period for calculating CAGR?
The ideal time period for calculating CAGR depends on the investment or business being evaluated. Generally, a longer time period provides a more accurate picture.
Can I use CAGR to compare different investments?
Yes, CAGR can be used to compare the performance of different investments, allowing us to make informed decisions.
How do I input data correctly into a CAGR calculator?
To input data correctly, we need to provide the initial and final values of the investment, as well as the time period. Our CAGR calculator provides guidance on data input.

